


Data Warehouse Essentials
When do you need a data warehouse? What is the most popular approach for creating a data warehouse? What is the source of the requirements? Who are the stakeholders? What are the relevant tools and technologies for a data warehouse?
In addition to answering these questions, this white paper focuses on the classical approaches to a layered data warehouse architecture, and we will examine two data modeling approaches – the Star schema and the Snowflake schema.
You will learn about fact tables, dimensional tables, and measures and how they are all related to each other in the schema. Finally, you will gain a conceptual understanding of data warehouse design and implementation.
Context and Background
Organizations are accumulating data at a rapid pace and facing the complexities of managing that data. Data in an organization is leveraged for multiple business objectives that span across different teams, departments, and business units. Customer Relationship Management (CRM) software, Enterprise Resource Planning (ERP) software, Human Resources, Accounting, Legal, Marketing, and Sales are just a few examples of software applications and business entities that are served by data and the data professionals who manage those repositories.
With the exponential growth of data, an organization’s objective of performing data analysis on accurate and relevant data faces additional challenges brought forth by how data is captured, stored, organized, and made available to consumers.
Tasks associated with business intelligence and data analytics vary depending on the goals of data users in an organization.
Examples of data features for performing analytics include:
- Creating a unified view of the data by eliminating multiple definitions of customers in your organization’s departments.
- Aggregating data on a big scale by a specific month, year, region, or customer category.
- Filtering data by specific criteria such as region, by date, or by product category.
When data is owned and managed by different teams in different business units, data silos are created. Data silos hinder sharing of data and foster duplication of data. Single Source of Truth (SOT) is the practice of collecting data across many locations in an enterprise and aggregating it into a single location that is then deemed as the enterprise authority for such data. Analytics and business intelligence require accurate and complete data that is based on the principle of SOT.
When data is aggregated into a single, central, consistent data store, it provides an optimal and consistent environment for users to perform data analysis, data mining, artificial intelligence (AI), and machine learning. A data warehouse plays a key role in accomplishing business goals dependent on consumer access to data based upon SOT.
Taxonomy
An awareness and understanding of concepts and terms associated with data warehouses makes it easier to comprehend the task flow for creating a data warehouse.
Data Sources
Multiple data sources exist in an enterprise, and these data sources can be internal or external to an organization. These data sources contain raw data that has not been modeled for use by applications and users for enterprise-level analytics.
Data Lake, Data Warehouse, and Data Mart
Data Lake
A centralized repository that contains raw, unstructured data, or structured data. Raw data can be suitable only for very targeted business use cases such as IoT devices, social media, machine learning, and streaming. A data lake requires data professionals to extract, transform, and load (ETL) ingested, wrangled, and curated data into a large, central repository known as a data warehouse. Data lakes are not always present in organizations’ data ecosystems, and data warehouses are not necessarily dependent on data lakes.
Data Warehouse
A data warehouse contains structured, purposeful, and clean data that empowers data consumers within an organization to gain insights and make decisions that are based on timely, complete, and accurate data. The implementation of analytical data processing yields structured data in the data warehouse that is suitable for multiple business functions such as obtaining fast query results and generating reports.
Business analysts, data scientists, and data developers benefit from curated data in a data warehouse. Analytics, batch reports, and visualizations are all facilitated quickly and efficiently for users with access to structured data in the data warehouse.
Data Mart
A data mart contains subsets of structured data available in a data warehouse. Data marts are created for users in specific departments, business units, teams, and communities that have a focused need for specific types of data. For example, structured and meaningful data associated with employees in an organization is relevant and required for personnel in the Human Resources department. A data mart can make employee data available to human resources with highly granular access privileges and authorization to view specific data.
Data Flow With and Without a Data Lake
We recommend using a data lake as an enabling precursor to a data warehouse. However, some organizations may choose not to have a data lake. We will examine the features of both scenarios.
Figure 1 illustrates the flow of data as it applies to data sources, data lake, data warehouse, and data marts.
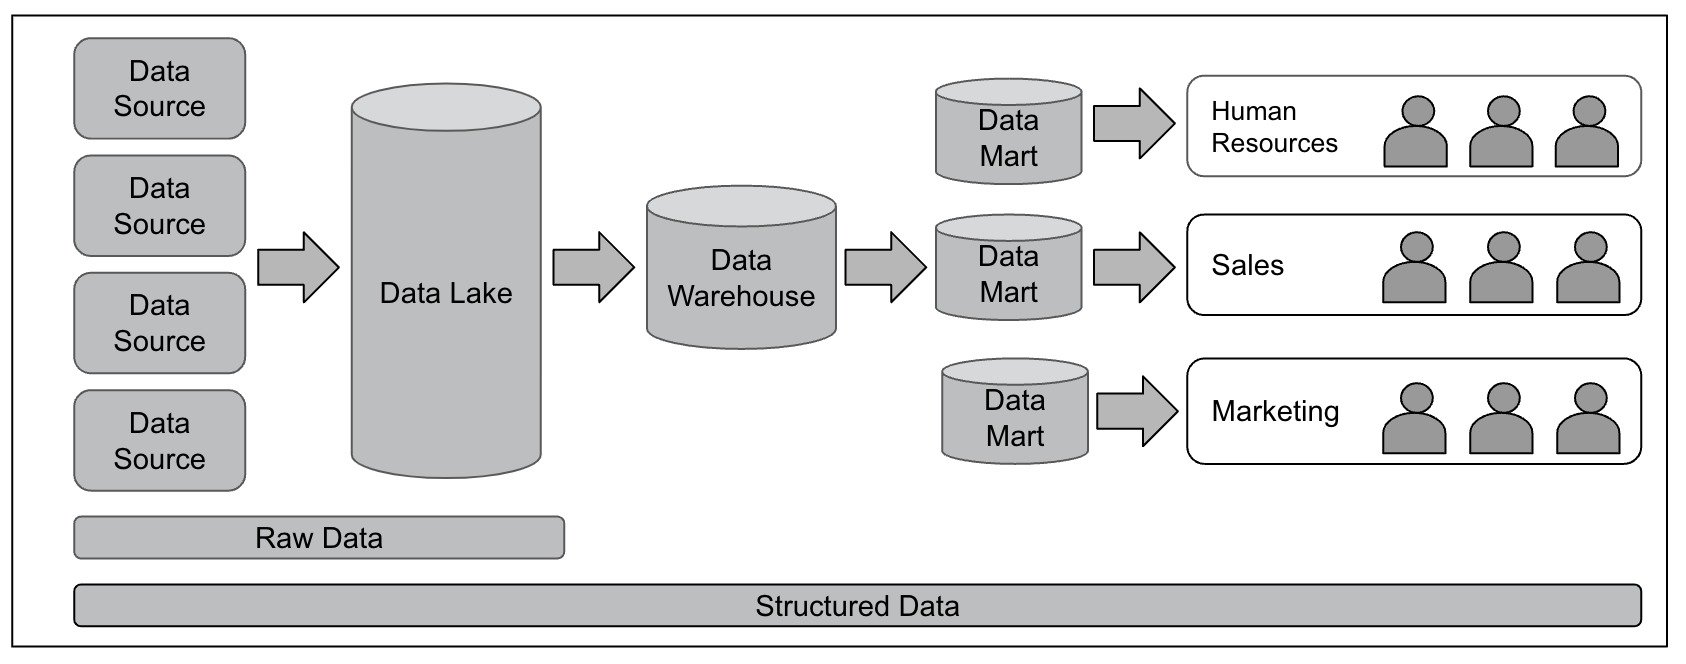
Figure 1 – Data Lake, Data Warehouse, and Data Marts
Figure 2 illustrates the flow of data as it applies to data sources and data marts without a data lake.
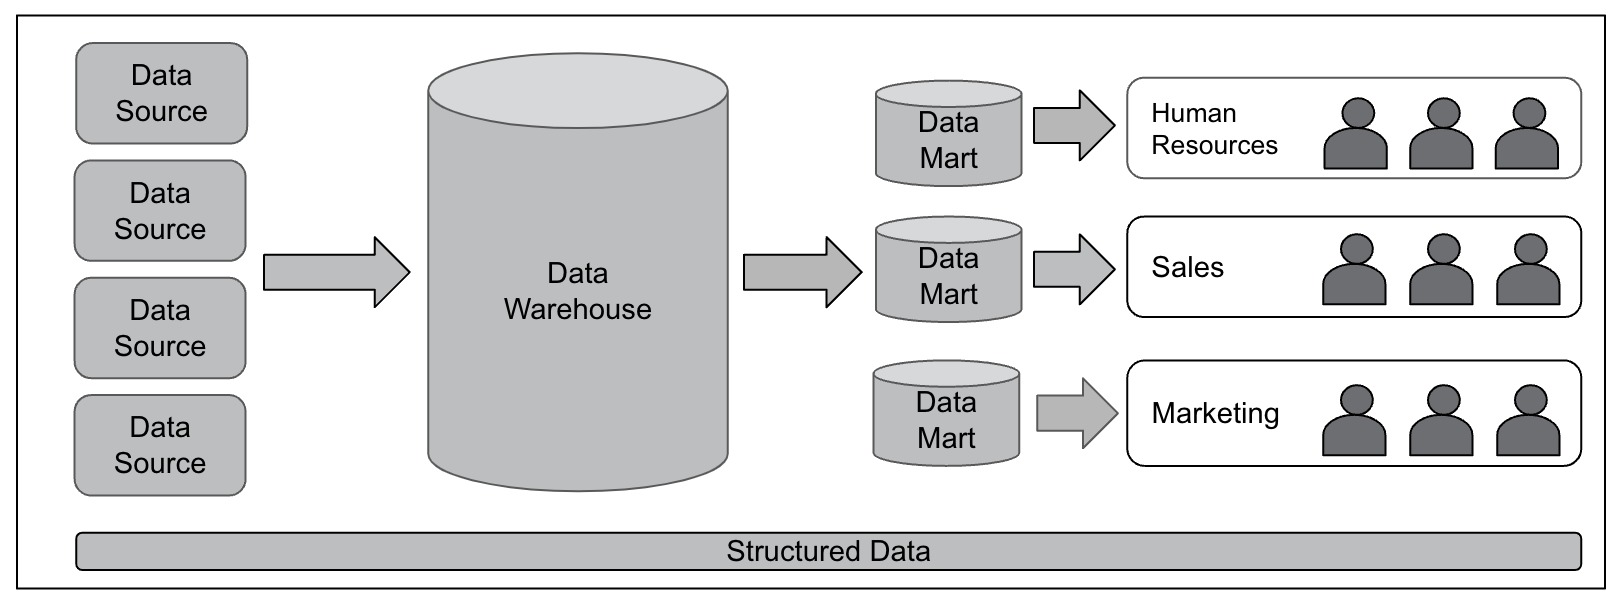
Figure 2 – Data Warehouse and Data Marts
Data Environments Without a Data Lake
As we noted, some organizations do not have a data lake in their data ecosystem. Data type and data size are factors that determine whether a data lake is needed. For example, a data lake may not be required if you only have structured data and have no plans to host unstructured data in your repository. A data lake is also unnecessary if the data volume or size does not justify the need for Big Data techniques.
Data environments without a data lake offer some benefits:
- A simplified architecture with fewer components and technologies
- Unified mechanisms of data transformation. For example, if you have only structured data, a data approach that is focused exclusively on SQL could be sufficient. There might not be a need for sophisticated frameworks that would be applied to the unstructured and semistructured data.
- It is easier to find data engineers with a specific technology focus (for example, Snowflake) and SQL skills.
In all other cases, we recommend that you establish a data lake as a data-wrangling mechanism before creating your data warehouse.
Extract, Transform, Load
The extract, transform, and load (ETL) process enables data professionals to combine data from multiple sources for transformation and load the transformed data into the data warehouse. Structured or unstructured data ingested from different sources is exported to a staging area where data is processed.
Examples of data processing can be the correction of data entry errors, misspellings, etc. Then, the data is transformed by applying a schema that was designed for the data warehouse. Finally, the transformed data is transferred from the staging area to the data warehouse. Two types of events that occur during the ETL process are Ingestion and Wrangling.
Ingestion – The process of transporting data from data sources to a target destination where the received data must align with a defined structure or format. The ingestion process can be performed in multiple ways. Ingestion can be scheduled and triggered by a request, or done on an ad-hoc basis as needed.
Wrangling – The process of converting and organizing raw data into a format usable for business needs such as analytics, visualizations, and more. Tasks performed during the wrangling process include cleaning data, removing duplicate data, merging data, filtering data, and making the data ready for use by consumers and applications.
Transactional vs Analytics Data Processing
Online Transactional Processing (OLTP) and Online Analytics Processing (OLAP) are two popular data processing approaches.
OLTP
Supports data for business transactions such as purchases, orders, returns, refunds, etc. This type of data organization is suitable for simple and instant queries and purely transactional data such as retail sales or financial transactions.
Examples of OLTP include transactions conducted at an ATM and credit card payment processing. An OLTP database is typically normalized, i.e., broken up into smaller chunks whereby redundancy is reduced or eliminated. While OLTP can be highly efficient for transactional data, it is not optimal or designed for performing analytics.
Several challenges are encountered when data formatted for OLTP is used for analytics. Overly complex SQL queries and multiple join operations occur because the data is normalized and spread across multiple tables. Analytics are resource-intensive, slow, and can impact other transactions in the database by causing performance degradation. Join, aggregation, and sorting create resource-intensive operations.
Transformation of normalized data to a format for analytics requires extra resources such as memory, IO, and CPU. Queries that run longer can consume database resources that could trigger lock issues. These locks can prevent the editing of data during the duration of the analytical query execution.
OLAP
Supports analytical data that is designed to organize large business databases. Data is optimized for complex queries that are targeted toward data mining, business intelligence, visualization, and reporting. OLAP data is typically multidimensional and denormalized.
Multidimensional data has a centralized fact table that contains dimensions. Denormalization is the process of making data efficient for analytical purposes by applying techniques such as the creation of redundant data and the reduction of tables/joins.
Canonical Data Model
A Canonical Data Model identifies entities, attributes, and relationships to create standardized and commonly accepted definitions in an organization. When data originates from multiple sources and heterogeneous systems, there is a need to standardize the data by establishing a set of rules that eliminate data redundancies and complexity. A canonical data model accomplishes this goal by enabling the creation of a coherent data model that is easily understood by consumers from various divisions in an organization.
Before creating a data warehouse and data marts, we recommend establishing a canonical data model first. The process requires interviews with stakeholders in your organization, discussing your approach to bring standardization, and reaching an agreement on the terms, attributes, and relationships that will be used to standardize data across the organization.
For example, the term customer might be used in several different ways in different departments of an organization – buyer, purchaser, consumer, client, shopper, and so on. The data professional’s goal is to review all of these terms, get buy-in for a single term from stakeholders across the organization (for example, customer), and ensure that data from all sources is standardized by using one single term instead of multiple terms.
Scoping Within the Enterprise City Map and the Enterprise Data Platform
When considering the role of a data warehouse within enterprise systems, we refer to the spectrum of data ingested and created by business units and the centralized data aggregation platform systems (for example, a Data Platform). See Figure 3.
Within a data platform, the data warehouse capability is located in a logical component within the Source of Truth (SoT) and Governance component that includes data modeling and data marts. The data warehouse is preceded by the data lake components that represent ingestion, wrangling, and data refinement. See Figure 4.
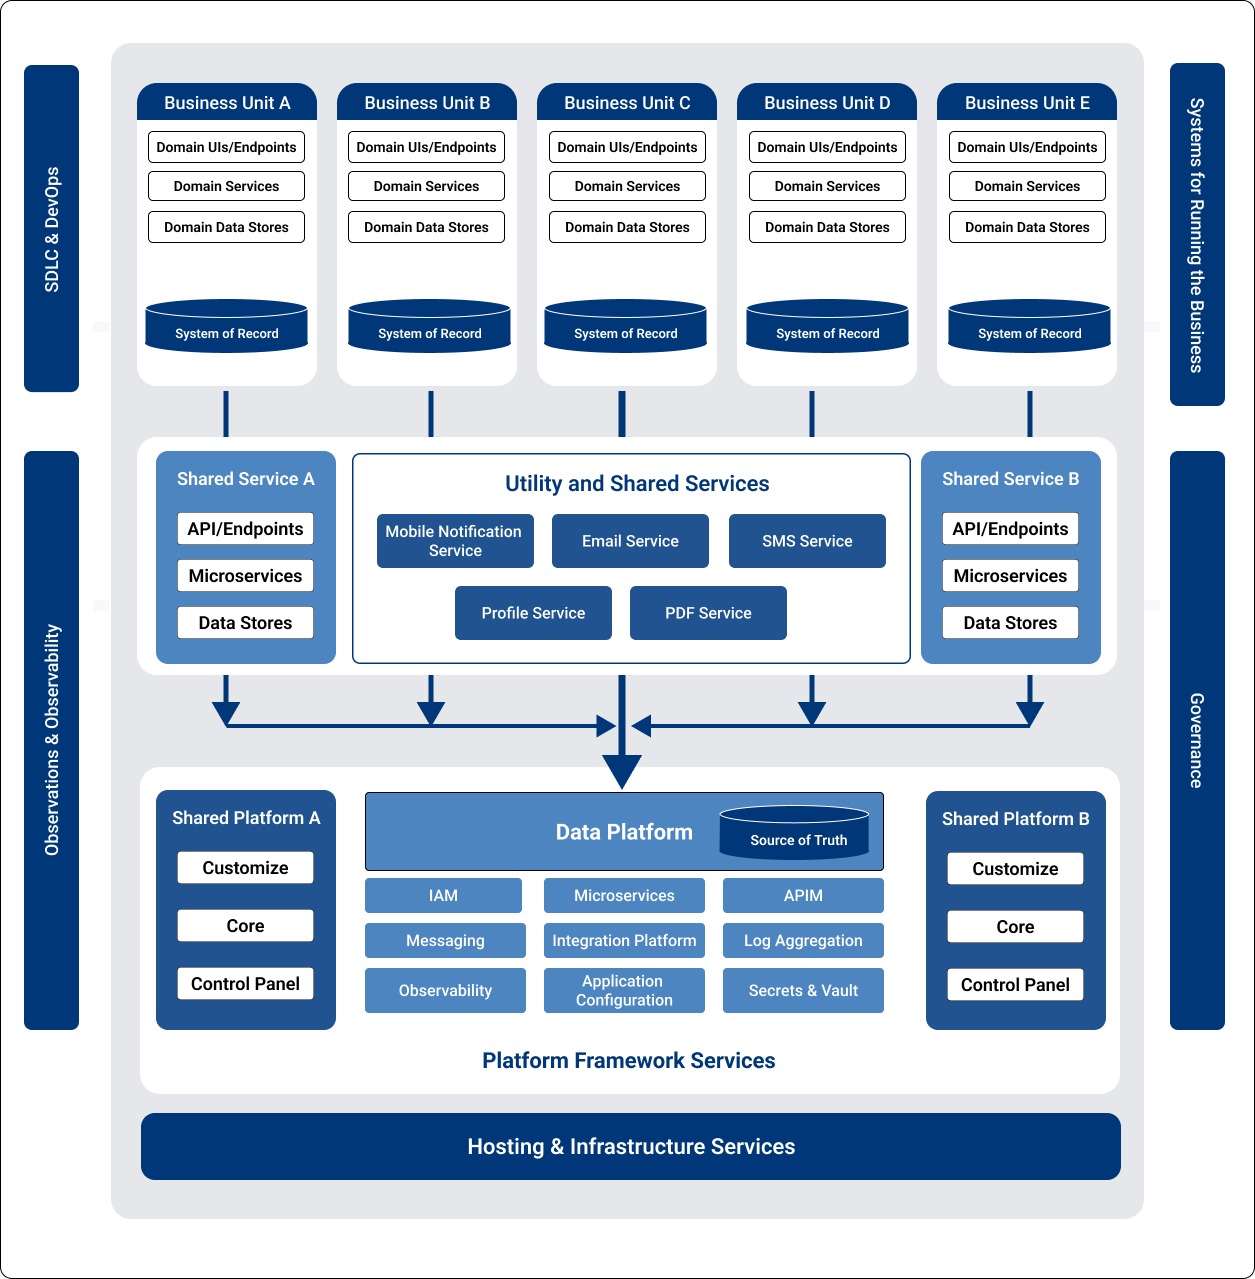
Figure 3 – Enterprise City Map
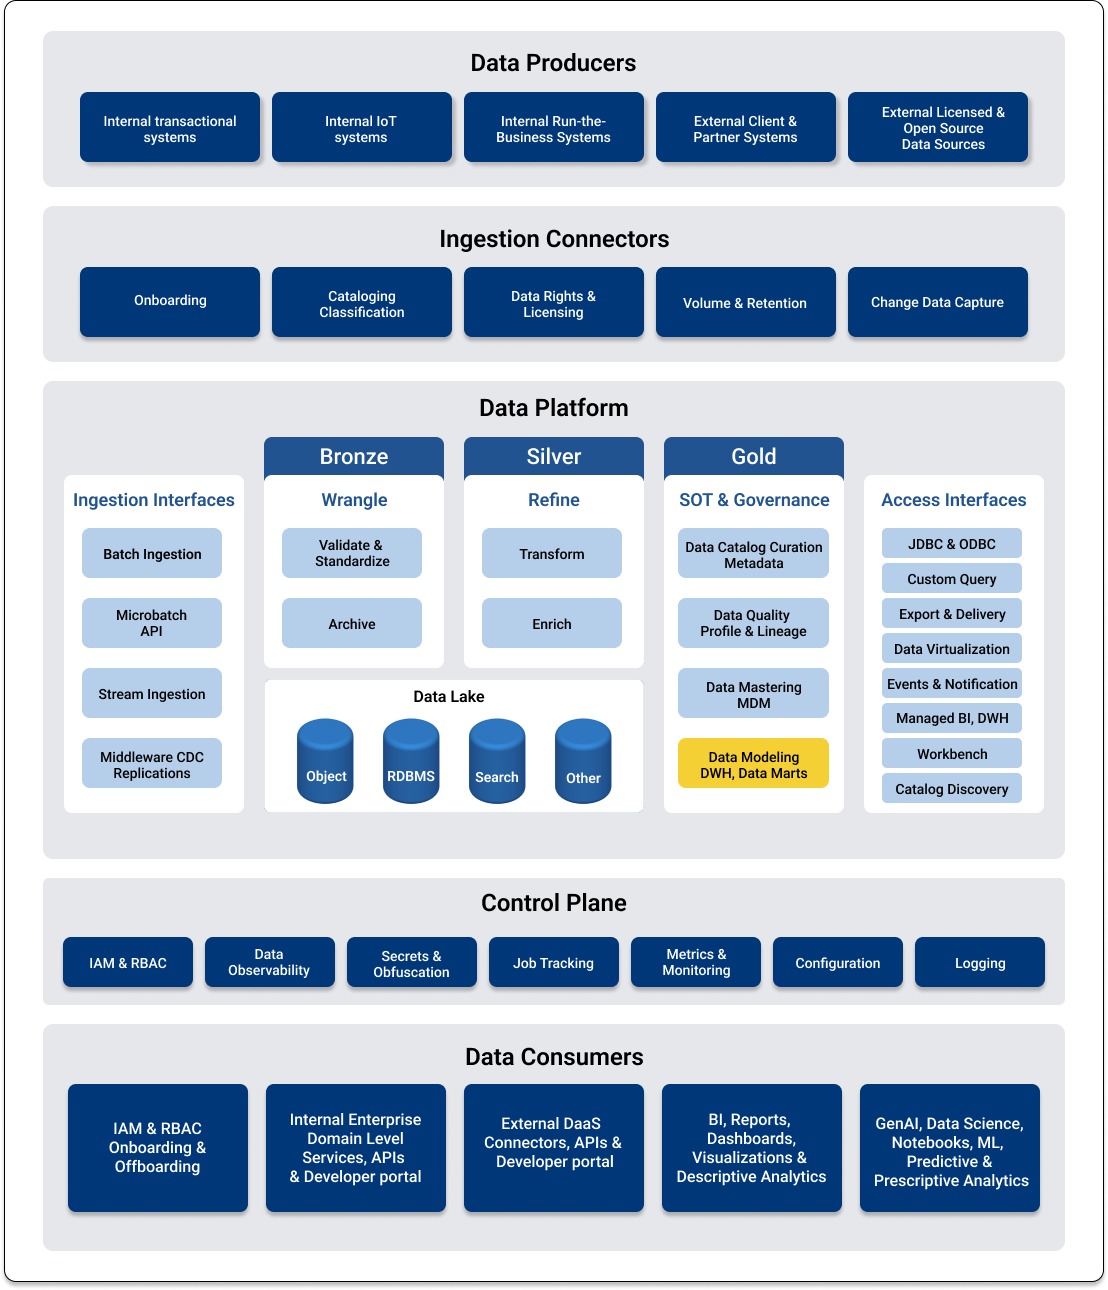
Figure 4 – Enterprise Data Platform
Implementing a Data Warehouse Solution
Building a data warehouse is a popular and efficient solution to create structured data that meets the analytical needs of an organization. Table 1 describes the features that apply to structured data hosted in a data warehouse.
| Features of Structured Data | Description |
| Denormalization | A schema that organizes columns (attributes) and tables (relations) of a database to improve the read performance of a database. In simple terms, denormalization introduces data redundancy by combining multiple table data into a single table data to ensure faster execution of queries. |
| Sparseness | Columns and rows in a database that may have many empty values. |
| Data Duplication | Duplicate data is allowed to exist. |
| Abstract Table Names | The unification of entities from multiple sources could lead to entity names such as a business entity (person and company) or a product (items and services), etc. |
Table 1 – Features of Structured Data
Modeling Approaches for Data Warehouses
When building a modern data warehouse that is designed to meet the needs for analytics, business intelligence, and reporting, data professionals should evaluate, select, and pursue a data warehouse approach and strategy that is suitable for their organizational needs. Every approach has pros and cons that need to be weighed when pursuing a solution. The following four approaches are popular for designing a data warehouse.
Kimball’s dimensional data warehouse – A bottom-up approach, meaning that your data warehouse design follows the design of your consumption patterns within the data marts. This commonly-used dimensional modeling technique ensures faster data retrieval, enables an analytics-centric solution, and implements fact and dimension tables that are based on the Star or Snowflake schemas.
Inmon’s enterprise data warehouse – A top-down approach that focuses on the integration of the data warehouse first. BilI Inmon’s design recommends the creation of a centralized, enterprise-wide data warehouse that stores normalized data. The data is channeled into different data marts that serve targeted data for subsets of data consumers and applications. A Star or Snowflake schema is applied to the normalized data in the data marts.
Data Vault – This advanced approach, which requires experienced data architects, was conceived by Dan Linsted. Data changes are captured when a data source is changed or added. This approach is grounded in the belief that all data is relevant data, and non-conforming data (data that does not conform to established definition and business rules) is not problematic for the data warehouse. Data vault modeling is centered around the concept of hubs, links, and satellites. Hubs represent business concepts, links represent associations between hubs, and satellites store information about hubs and their relationships. Data conversion is required for businesses with a need for dimensional modeling.
Anchor Modeling – This is an advanced modeling technique for capturing changes that occur when a source is changed or added and requires the expertise of data architects. Compared to the Data Vault approach, Anchor Modeling is highly flexible for source data changes. However, this modeling technique introduces greater complexity due to the increased number of tables.
Engagement with Stakeholders
We reviewed the importance of establishing a Canonical Data Model before engaging with data transformation and modeling. This effort requires engagement with stakeholders across the organization to facilitate a discussion and agree on a common understanding and definition of fact tables, dimension tables, measures, attributes, and more. Stakeholders in this effort can include team members from product management, enterprise architecture, architecture review teams, data quality, data security, compliance, DevOps, hosting and infrastructure, operations, and administration.
The goal is to facilitate data processing by standardizing data definitions with standardized structures and resolving any differences created by the same data objects in different data sources. The benefits of standardizing data with a Canonical Data Model include increasing trust in the data, unification of taxonomies for the enterprise-level analysis, and a simplified ETL process for populating data into the data warehouse.
Architecture
A data warehouse architecture consists of layers that correspond to the tasks associated with preprocessing raw and unstructured data into structured data. Layers enable us to understand and classify the status and type of data as it flows progressively through each layer. Data ingestion, preprocessing, and transformation ensure that the final layer offers data quality to consumers.
Before we examine the layers in the Data Warehouse architecture, a basic understanding of ingestion is required.
Data Ingestion Techniques
Data ingestion is the process of obtaining data from several raw data sources and moving that data to the first layer. The process of data transformation first begins with data ingestion, where large amounts of raw data are ingested from several data sources. Here are two techniques for performing data ingestion:
Batch Data Ingestion – Groups of raw data are extracted and transported from data sources to the first layer. Batch processing can also be performed between the layers of a data warehouse architecture. Batch processing is inexpensive because fewer computing resources are required. However, this process can also be slow.
Streaming Data Ingestion – Data is continuously moved from the raw data sources to the first layer. With streaming data ingestion, data availability is quicker and faster for business environments where timely, accurate, and fresh data is required for business intelligence. Although streaming ensures a continuous flow of data, when the streamed data is ingested into the data warehouse, it may be transformed into batches.
Data Warehouse Layers
We will review three primary layers of the data warehouse architecture (first, second, third) – which are classified as bronze, silver, and gold to indicate the quality of data. Each layer has a different purpose, and the data quality varies depending on the layer where the data is located.
Figure 5 shows the three layers of a data warehouse during the progressive data journey of extracting, transforming, and loading data into a data warehouse. An explanation of each layer follows the figure.
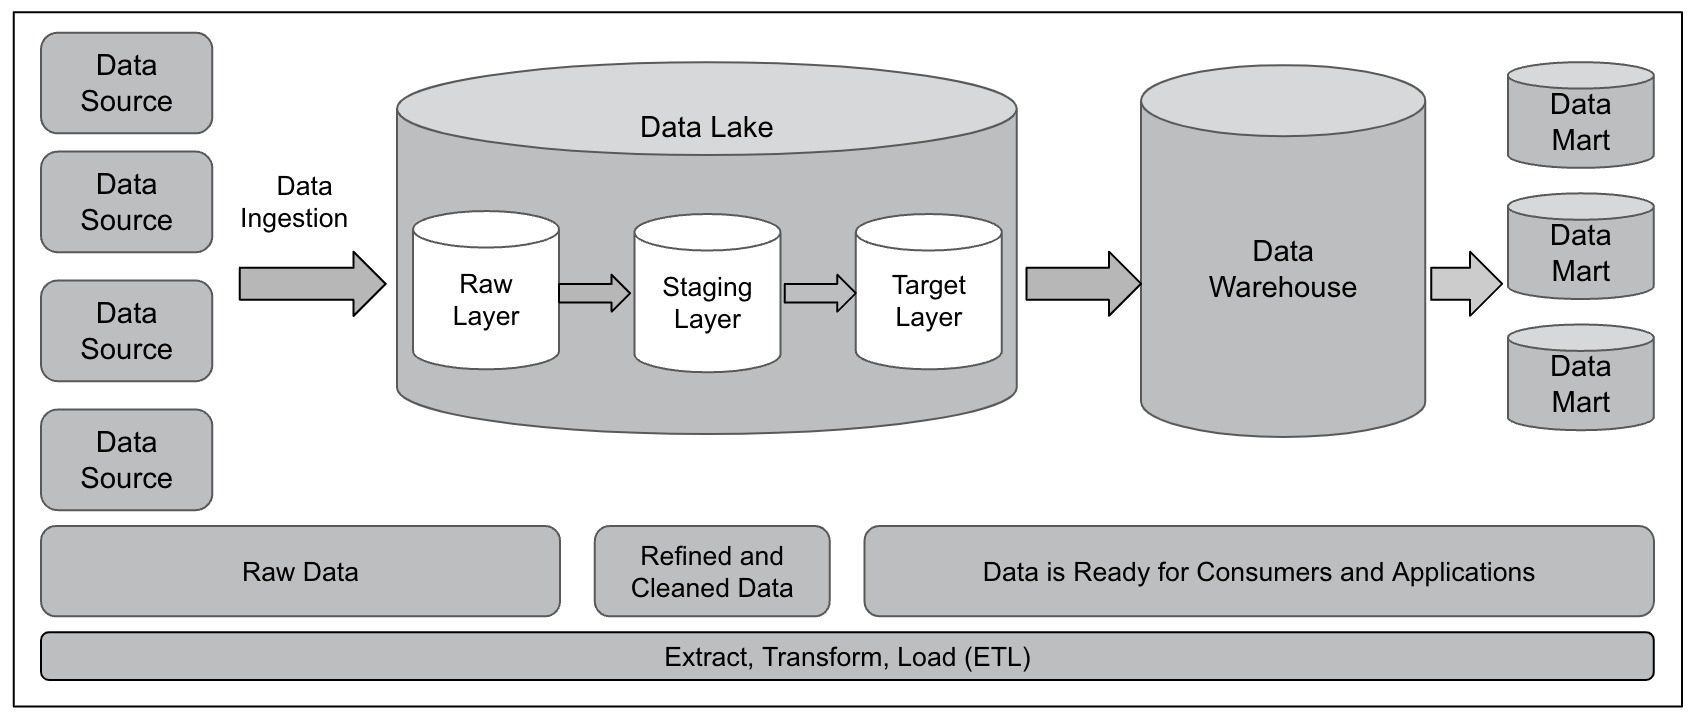
Figure 5 – Layers of a Data Warehouse
First Layer
Data from various sources is extracted, ingested, and transported into the first layer, which corresponds to raw data that is classified as bronze. In the ETL process, this is the layer that corresponds to the task of extraction. When data arrives in the first layer, it is identical to the raw data in the data sources. The extracted data is placed in a dedicated area. The table structure is identical to the tables in the data sources, and this raw data is classified as bronze. Row-level data quality checks are performed in this layer (for example, date format and address format).
Second Layer
In the second layer, where data is classified as silver in the staging area, cleaning, refinement, and normalization tasks are performed. In the ETL process, this layer corresponds to the task of data transformation.
Data originating from multiple sources can have multiple references and labels for a single item. You have the option to introduce a Canonical Data Model at this layer. A Canonical Data Model standardizes data by facilitating an agreement between different stakeholders in the organization. Data redundancies are eliminated or minimized to ensure that there is a single reference to a data item (for example, using the term Customer instead of Purchaser, Buyer, Shopper, etc).
If your environment does not have a data lake, you can apply a Star or a Snowflake schema to the data in this layer. Facts are typically collections of numeric values that can be aggregated, and dimensions are groups of hierarchies and descriptors that define the facts. Merging and matching of data is performed in this layer. Basic checks for quality (for example, data freshness and basic business rules) are performed in the second layer.
Third Layer
The data already has a schema that was applied, and it is loaded into the data warehouse. At this third layer, the data is classified as gold. Data is denormalized with fewer joins. Full-scale data quality checks (data accuracy, data integrity and more) are performed at this stage, and data in this layer is ready for consumers and analytics. Techniques such as Slowly Changing Dimensions are performed at this layer.
Figure 6 shows data warehouse layers without a data lake.
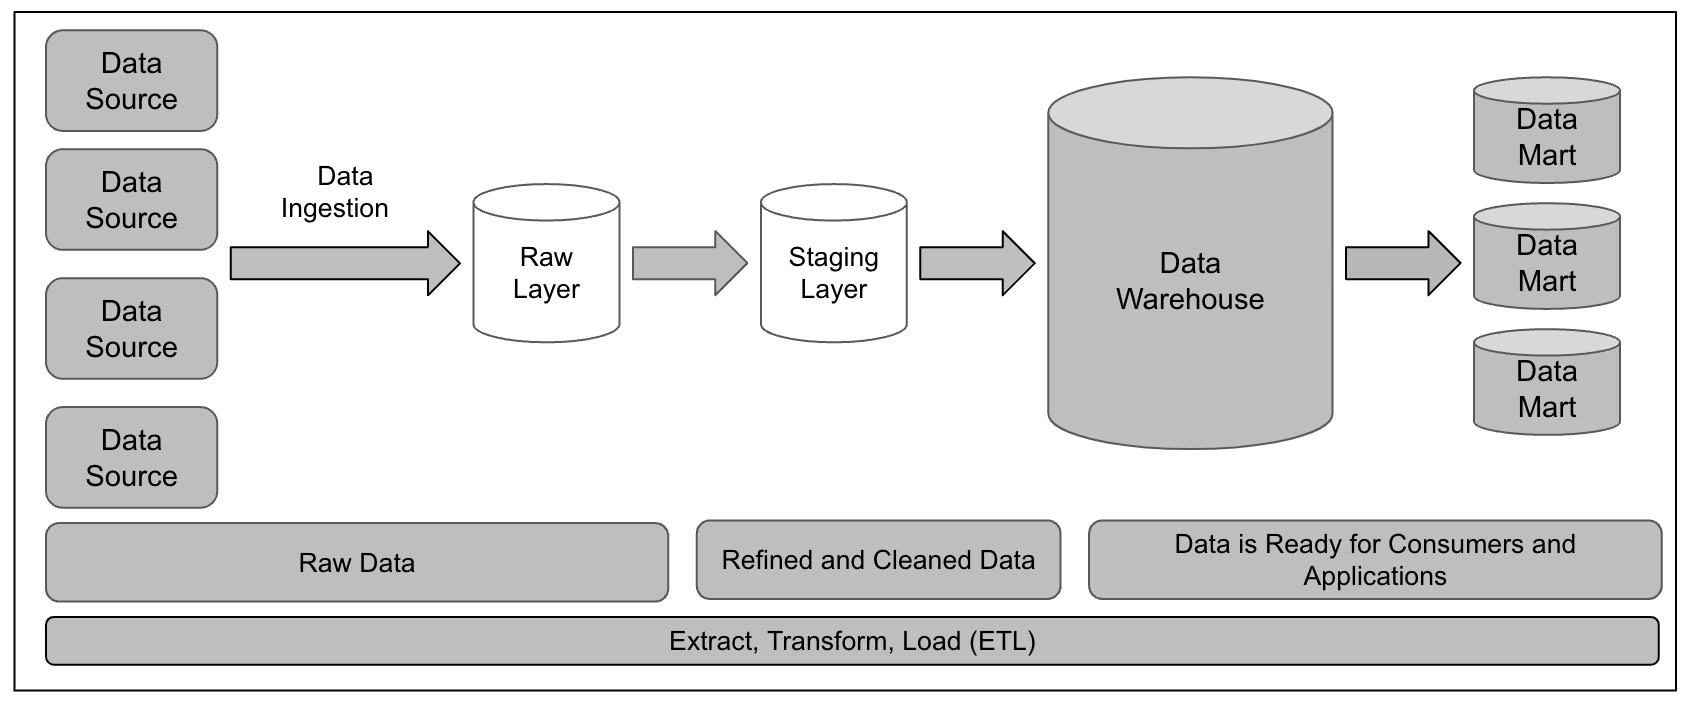
Figure 6 – Layers of a Data Warehouse Without a Data Lake
Dimensional Modeling With a Schema
A schema plays an important role in transforming raw, structured data into usable data that can be leveraged by consumers and applications for analytics, business intelligence, machine learning, IoT, and more. Let’s look at two popular schemas that enable dimensional modeling – the Star schema and the Snowflake schema. Both schemas are modeled around a fact table and dimension tables.
Understanding the Schema
Fact tables and dimension tables play key roles in a database that is modeled with a schema. Here are some definitions of these important concepts associated with schemas.
Fact table – Facts are typically collections of numeric values that can be aggregated. The fact table is associated either with a single set of dimension tables or dimension tables that represent multiple levels of relationships with additional dimension tables. An example of a fact table is the sales data for a shop that includes total sales, taxes, discounts, quantity, and so on.
Dimension table – Dimension tables store details and attributes associated with the facts in a fact table. For example, if housing units were one of the facts in a fact table for demographics, the dimension table might include various aspects of housing units such as owner-occupied homes, rental homes, gross monthly rent, and so on.
Star schema – A database structure where a fact table is associated with dimension tables, and these dimension tables have no further connections to other dimensions. An example of a Star schema is a fact table with columns for sales data (the item being sold, quantity sold, etc ) that has dimension tables with data on the location of the sale, time and date of sale, the specific model that is being sold, the salesperson doing the sale and so on. The Star schema follows a denormalized (meaning duplication is OK) data structure that is applied to the tables.
Snowflake schema – A database structure where a fact table is associated with multiple dimension tables that represent multiple levels of relationships. Resembling the shape of a snowflake, this schema is more complex than the Star schema because the normalized dimension tables are supplemented by additional dimension tables.
Using a Star Schema
Dimensional modeling with a Star schema consists of a fact table connected to multiple dimension tables with denormalized data. A fact table contains events such as the purchase of an item, the date of the purchase, the cost of the purchase, and so on. The quantitative values in fact tables are called measures that can be Item_Count, Tax_Amount, and Discount_Amount. Fact tables have a reference to dimensions. However, these dimensions don’t have any references to other dimensions.
In Figure 7, the fact table shows facts or observations and measures for the sale of an item, such as the date of the sale, the location of the sale, etc. A measure is a column in a fact table that stores numerical and quantitative values. In this example, each fact has a reference to four dimensions (DIM_Date_ID, DIM_Location_ID, DIM_Product_ID, and DIM_Branch_ID) that provide additional information for each of these items. These dimension tables, which determine the dimensionality of the fact table, contain attributes that are used for analysis (for example, Day, Month, Year).
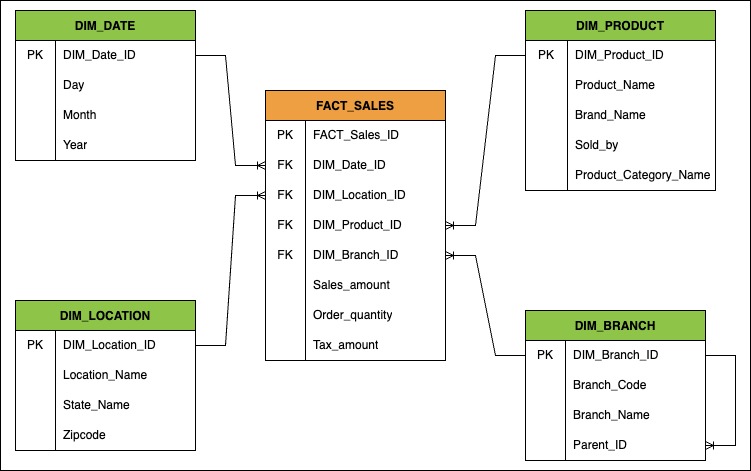
Figure 7 – Fact and Dimension Tables in a Star Schema
Using a Snowflake Schema
In a Snowflake schema, fact tables are connected to multiple dimension tables and the overall presentation resembles a snowflake. Unlike the Star schema, organizing data with a Snowflake schema is complex, requires more detailed planning upfront, and data is normalized extensively.
Figure 8 shows the Snowflake schema. We have three extra dimension tables that are associated with the DIM_Product and DIM_Location dimension tables. The three additional dimension tables (DIM_Product_Category, DIM_Brand, and DIM_State) are referenced by their parent tables. However, we do not normalize DIM_Branch or DIM_Date dimension tables. Instead, we extract data from the three additional dimension tables.
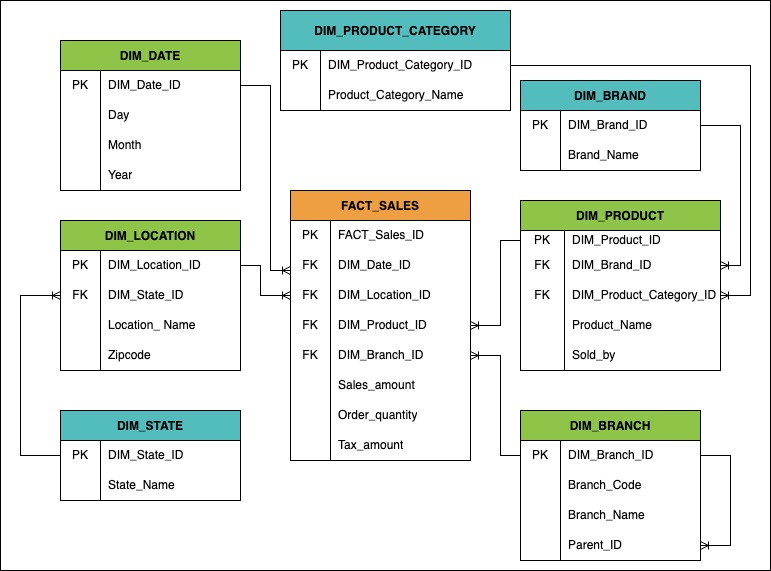
Figure 8 – Fact and Dimension Tables in a Snowflake Schema
Comparing Star Schema with Snowflake Schema
The Star and Snowflake schemas are differentiated by the level of normalization that is applied to the tables. A quick look at Second Normal Form (2NF) and Third Normal Form (3NF) provides context for understanding their differences. The 2NF refers to the denormalization of databases by introducing data redundancy and improving analytical performance. The 3NF form uses normalization to reduce data duplication, avoid data discrepancies, ensure integrity, and simplify data management.
In the Star schema that we examined, all tables, except DIM_Branch and FACT_Sales, are at the 2NF level. The DIM_Branch and FACT_Sales have the 3NF. In the Snowflake schema, all tables have 3NF with the exception of DIM_Date, which has the 2NF. The DIM_Branch table for the Snowflake schema has no changes because it is already normalized to the 3NF form. In the Snowflake schema, there is no change to the DIM_Date table because it is an artificial static dimension that requires no updates in the future.
The Ideal Schema
How do you determine the ideal schema for data in your organization? Table 1 provides recommendations for schema usage.
| Description | Star Schema | Snowflake Schema |
| The majority of dimension tables have fewer than 1000 rows. | Recommended | N/A |
| The majority of dimension tables exceed 1000 rows. | N/A | Recommended |
| A goal to minimize resources for data retrieval. | Recommended | N/A |
| Data consumption patterns demonstrate the need to extract unique values from specific columns of a dimension table frequently | N/A | Recommended |
| A goal to minimize disk space occupied by data. | N/A | Recommended |
Table 1 – Criteria for Selecting a Schema
Technologies for Building a Data Warehouse
The two major database engines available for building a data warehouse design include row and columnar-oriented databases. Row-oriented databases are supported by MS SQL Server (default engine), MySQL (MyISAM engine), Postgres (default engine), and Oracle (default engine). It is cost-effective to build a data warehouse that is based upon a row-oriented database where OLTP and OLAP database functions are treated separately. However, we strongly recommend columnar engines for optimal performance with data analytics.
Columnar databases for analytics provide the following benefits:
- When hundreds of columns are present in a table, you only need a small subset of those columns. A classical row-oriented engine needs to scan all data and pick the required columns. A columnar engine, however, would scan only columns requested by the user.
- A columnar engine is highly optimized for sparseness (multiple NULL values). When advanced algorithms are used, it is easier to compress sparse data when it is columnar.
- A columnar engine is highly optimized for aggregation operations (aggregation is a typical analytical operation).
We recommend that you select a tool that supports columnar engines.
Available Tools and Platforms
The following is an alphabetical list of notable industry tools and resources for building a modern data warehouse:
Amazon RedShift – RedShift is built on top of the massively parallel processing (MPP) data warehouse technology in AWS to handle large-scale data sets and database migrations.
Apache Arrow – Provides a language-independent columnar memory format for flat and hierarchical data that is organized for efficient analytic operations on modern hardware with CPUs and GPUs.
Apache Druid – Quickly ingests massive quantities of event data and provides low-latency queries on top of the data. This is a column-oriented, open-source distributed data store written in Java.
Apache Optimized Row Columnar (ROC) – A free, open-source, column-oriented data storage format. It is similar to the other columnar-storage file formats available in the Hadoop ecosystem such as RC File and Parquet. This data format is present in data processing frameworks such as Apache Spark, Apache Hive, Apache Flink, and Apache Hadoop.
Apache Parquet – An open-source, column-oriented data file format designed for efficient data storage and retrieval. It supports efficient data compression and encoding schemes with enhanced performance to handle complex data in bulk.
Azure Synapse Analytics – A cloud-based data storage and analytics service that is referred to as data-as-a-service in the Azure environment.
BigQuery – Google’s fully managed, serverless data warehouse that enables scalable analysis over petabytes of data. It is a Platform-as-a-Service (PaaS) that supports querying by using ANSI SQL and provides built-in machine-learning capabilities.
Delta Lake – An open-source storage layer for creating reliable data lakes. Delta Lake supports ACID transactions, scalable metadata handling, and unifies streaming and batch data processing. Delta Lake is compatible with an existing data lake and Apache Spark APIs.
Snowflake – A cloud-based data storage and analytics service referred to as data-as-a-service. Enables organizations to store and analyze data by using hardware and software resources in the cloud.
Conclusion
In this paper, we examined the requirements of a modern data warehouse that can serve the multiple needs of data consumers and applications across an enterprise. We learned the importance of standardization by establishing a canonical data model and the upfront planning it takes by engaging with stakeholders and reaching an agreement on how to structure the data. Dimensional modeling prepares data for use with analytics, business intelligence, machine learning, IoT, and more. Star and Snowflake are two popular schemas that enable dimensional data modeling for a data warehouse.
References
- Adamson, Christopher. Star Schema The Complete Reference. First Edition. McGraw Hill, 2010.
- Avila, Joyce Kay. Snowflake The Definitive Guide. First Edition. O’Reilley Media, Inc. 2022.
- Corr, Lawrence and Stagnitto. Agile Data Warehouse Design. DecisionOne Press. 2014.
- Hoberman, Steve. Data Modeling Made Simple. Second Edition. Technics Publications, LLC. 2016.
- Cote, Christian et al. Data Warehousing with Azure Data Factory. Packt Publishing Ltd. First Edition. 2018.
- Inmon, William H. Building the Data Warehouse, Fourth Edition. Wiley Publishing, Inc. 2005.
- Kimball, Ralph, and Ross, Margy. The Data Warehouse Toolkit. Third Edition. John Wiley & Sons, Inc, 2013.