-
-
-
-
URL copied!
Microservices are a development methodology where services are independently developed and deployed. This type of architecture has become popular over recent years due to its ability to decouple systems and improve the speed of delivery. To test these applications effectively, they require specialized tools and processes.
Given the volume of independent services communicating with one another, test automation in a microservices architecture can be complex. Despite this, there are several compelling benefits to the microservices architecture, which we’ll discuss in this article.
What is a Microservice Architecture Style?
By definition, a microservice architecture style is used to develop a single application with separate processes for each mechanism. These “small services communicate by accessing each other’s exposed application programming interfaces (APIs).
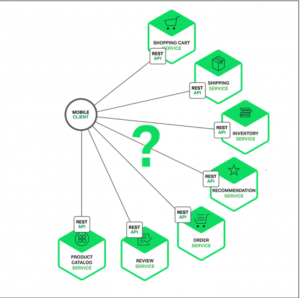
A typical example is Amazon’s online shopping. As shown in the diagram below, each lightweight service runs independently from the others. Even if there’s a failure at the payment gateway, users can still add items to their shopping carts and look at other modules. Using this setup, the loss of one module does not ruin the entire system.
The benefits of this approach include the following:
- Each component has its lifecycle. This means that it can be scaled up or down as needed.
- It’s easy to test individual components because they don’t depend on any other system part.
- You can use different deployment strategies, such as cloud-based hosting or self-hosted solutions.
- You can deploy multiple software versions simultaneously without affecting the system’s overall performance.
Recommended reading: Strategies for Digital Transformation with Microservices [Whitepaper]
Why Use Microservices?
There are several reasons why organizations should adopt a microservices architecture. Some of the most common include:
Increased agility. By breaking large monolithic applications into smaller pieces, teams can quickly respond to changes and make improvements.
Improved scalability. It’s easier to scale out than to scale up. If you need more capacity, add additional servers instead of rewriting the code.
Faster time to market. You can release new features faster because you don’t have to wait for a team to complete an entire application before releasing it.
Reduced complexity. A microservices architecture reduces the number of dependencies between components. This makes testing much more straightforward.
Fig. 1: Amazon microservice architecture
How Do Microservices Work?
When developing a microservices architecture, you break down a monolith application into small services. Each service exposes a set of APIs that allow other services to interact with it.
For example, let’s say you have a web app that allows customers to create accounts. You could build a service that handles user registration. Another service might handle authentication. And another manages customer data.
When a request comes in, the client sends it to the appropriate service. That service then performs its function and returns the results to the client.
This model works well when all the services run in the same environment. However, if you want to host these services in different environments, you must expose the API so that clients can access them.
Issues with Microservice Architectures
Even though a microservice architecture approach to software development provides countless benefits, it has some drawbacks in reporting. For example, it can be a hassle to analyze test results, identify pass/fail ratios and trends, and understand the total execution time for a particular microservice regression suite. In addition, you must ensure that the communication between services is secure.
Let’s consider the below sample microservice architecture for Netflix, where there is an ‘n’ number of services running. To maintain a stable automation pipeline, you must obtain data that answers the following questions:
- Which services have a maximum execution time?
- Which services have more failures?
- What are the trends in service execution times? Are they up or down?
- I have the name of services with a maximum number of failures, but how do I drill down and check based on the scenario?
- Can I see a list of scenarios failing for quite a long time, and if the age of failing is high?
- Can I get all the details of the service that has the latest build installed?
Fig. 2: Netflix microservice architecture
Effective Microservice Management
We’ve found that one way to manage the different requirements listed above successfully is to integrate all the services into a single platform. For example, we developed a custom dashboard for a client that can be used as a report generation tool and monitor more than 50 microservices (with the potential to be extended to 100+).
The main objective of this dashboard was to be a one-stop shop for all automation reporting, trends, and monitoring. To create this dashboard, we used the following technologies:
- Spring Boot
- Spring Thymeleaf
- Maven
- Java 1.8
- Couchbase DB(Can be any DB)
- Jenkins client api
- D3.js
The dashboard was so successful that we now implement it in other projects. Below are the different reports we created to improve our automation health.
Overall Microservices Tab
This tab will answer most of the below data queries, including the historic (previous build) data.
- Build data for all the microservices.
- Duration of that microservice suite.
- Total test case count, fail test case count, etc.
Fig. 3: Overall Microservices Tab
Recommended reading: Time Series - Data Analysis & Forecasting [Whitepaper]
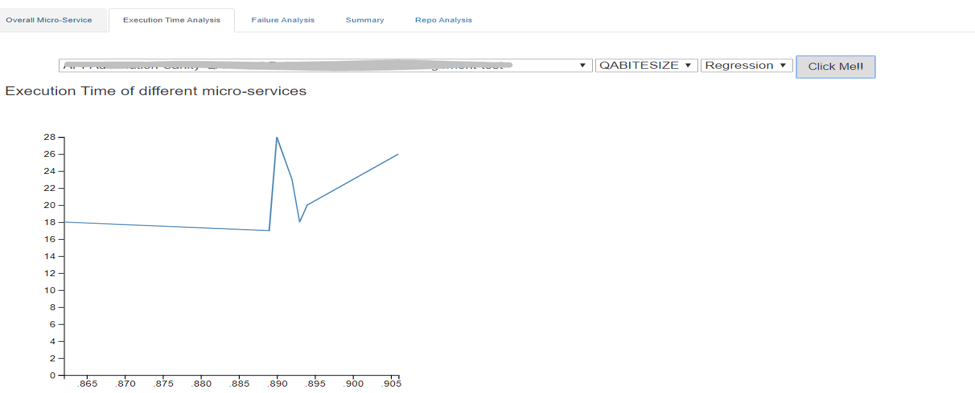
Execution Time Analysis Tab
This tab is a graphical representation of the above data that displays your microservice automation health trends. We can filter down based on environment and type of run (i.e., smoke, regression, etc.).

Failure Analysis Tab
This is one of my favorite reports. It tells us two essential parameters (“age” and “failed since”) so we can easily dig down to the scenarios that are failing over a long period. This report ultimately helps us improve our smoke suite (if it’s an application issue) or the quality of the automation test case (if it’s an automation issue).

Summary Tab
This tab is helpful for managers to obtain the latest consolidated report for all microservices of their latest runs.
Repo-Analysis Tab
Larger, distributed teams where people work in different branches can find QA challenging. For example, while they might merge their code during intermediate runs to develop an interim branch, it’s easy to forget to merge their code into the main branch. This oversight can create issues during deployments, as there are always substantial differences between these individual developers and main branches.
To resolve this issue, we developed a matrix that can tell the difference between the commits of these various branches and raise an alert when needed—an auto-scheduler triggers every hour and updates the latest data in the database.

Conclusion
There a numerous use cases for microservice to increase the efficiency of internal processes. With the right tools and the information above, companies can seamlessly integrate a microservice architecture.
At GlobalLogic, consolidating requirement variations and system reports into a single dashboard has been highly influential in managing microservices. Although the specific docker files for this dashboard are proprietary to GlobalLogic, I encourage you to use the information to create your microservice dashboard.
More resources:
- Read: Microservice Architecture: API Gateway Considerations
- Learn: Cloud-Driven Innovations: What Comes Next?
- Explore: GlobalLogic Microservices Accelerator
Top Insights
Innovators and Laggards: The Technology Landscape of 2019
Digital TransformationPerspectiveAutomotiveCommunicationsConsumer and RetailFinancial ServicesHealthcareManufacturing and IndustrialMediaTechnologyTop Authors
Blog Categories

Let’s Work Together
Related Content
GenAI in Action: Lessons from Industry Leaders on Driving Real ROI
Generative AI (GenAI) has the potential to transform industries, yet many companies are still struggling to move from experimentation to real business impact. The hype is everywhere, but the real challenge is figuring out where AI can drive measurable value—and how to overcome the barriers to adoption. In the latest episode of Hitachi ActionTalks: GenAI, … Continue reading Best Practices for Microservices QA Automation →
Learn more
Unlock the Power of the Intelligent Healthcare Ecosystem
Welcome to the future of healthcare The healthcare industry is on the cusp of a revolutionary transformation. As we move beyond digital connectivity and data integration, the next decade will be defined by the emergence of the Intelligent Healthcare Ecosystem. This is more than a technological shift—it's a fundamental change in how we deliver, experience, … Continue reading Best Practices for Microservices QA Automation →
Learn more
Share this page:
-
-
-
-
URL copied!


